On Maximizing Your Rust Code's Performance

While following the rules of Rust will get you a long way, it's still very possible to write bad, inefficient programs in Rust. In order to maximize the performance of your Rust applications, you'll need to understand the underlying hardware architecture that powers your code, how to optimize your algorithms and data structures, and how to profile and benchmark your code. In this article, we'll briefly cover these topics and more, hopefully giving you a better understanding of how to write performant Rust code.
This article assumes that you have basic knowledge of Rust, including its syntax, intricacies, and rules. If you're new to Rust, I recommend starting with the official Rust documentation and tutorials before diving into performance optimization. Remember, you never want to optimize prematurely!
Understanding Hardware Architecture
In order to start writing more efficient Rust code, you should first have a basic understanding of a machines underlying hardware architecture, including the CPU, memory hierarchy, and caching. Understanding these concepts can help you make more informed decisions about how you structure your code and data, allowing you to take advantage of your hardware's capabilities.
The CPU
The CPU is basically the computer's processing powerhouse. It executes instructions and carries out calculations, making it one of the most important components when it comes to performance.
The CPU consists of multiple cores, each capable of executing instructions independently. In order to fully utilize these cores, it's important to write code that takes advantage of parallelism and executes multiple processes at the same time.
Let's say we have a large collection of images that need to be resized. If we do so sequentially, it'll take a long time since each iteration has to wait for the previous one to finish. For example, this function handles image resizing sequentially in a for loop:
1fn resize_images_sequentially() {
2    // Load a collection of images
3    let images = vec![
4        "image1.png",
5        "image2.png",
6        "image3.png",
7		...
8    ];
9
10    for image_path in images {
11        // Load the image from disk
12        let img = image::open(image_path).expect("Failed to open the image");
13
14        // Resize the image
15        let resized_img = resize_image(img);
16
17        // Save the resized image to disk
18        let output_path = format!("resized_{}", image_path);
19        resized_img.save(output_path).expect("Failed to save the resized image");
20    }
21}
Using parallelism, we can distribute the resizing task across many CPUs cores, allowing us to process multiple images simultaneously. Lucky for us, Rust's standard library comes packed with helpful multithreading features, so we can start easily implementing multithreading in a memory-safe way:
1fn resize_images_in_parallel() {
2    // Load a collection of images
3    let images = vec![
4        "image1.png",
5        "image2.png",
6        "image3.png",
7        ...
8    ];
9
10    let mut handles = vec![];
11
12    for image_path in images {
13        // Spawn a new thread for each image processing task
14        handles.push(thread::spawn(move || {
15            // Load the image from disk
16            let img = image::open(image_path).expect("Failed to open the image");
17
18            // Resize the image
19            let resized_img = resize_image(img);
20
21            // Save the resized image to disk
22            let output_path = format!("resized_{}", image_path);
23            resized_img.save(output_path).expect("Failed to save the resized image");
24        }));
25    }
26
27    // Wait for all threads to finish
28    for handle in handles {
29        handle.join().unwrap();
30    }
31}
Parallelism and concurrency can significantly speed up your code, and you should try to use it wherever it proves effective. As you can see, the parallel function finished over twice as fast as the sequential one:
1benchmark_resize_images_sequentially:
2    104.509ms ± 25.90ms per run ( with 100_000 runs ).
3benchmark_resize_images_in_parallel:
4    219.319ms ± 71.21ms per run ( with 100_000 runs ).
Memory Hierarchy
Memory hierarchy refers to the different levels of memory in a computer system, ranging from fast but small caches to slower but larger main memory.

When writing efficient Rust code, it's important to minimize cache misses by organizing your data in a way that maximizes spatial locality (accessing nearby memory locations) and temporal locality (reusing recently accessed data).
A simple example of this is using structs to group related data together, which can improve spatial locality because struct elements are more likely to reside close to eachother, reducing cache misses. Rather than doing something like:
1let x = 1;
2let y = 2;
3let z = 3;
4
5// do something with x, y, and z
You can group the variables in a struct:
1struct XYZ {
2    x: i32,
3    y: i32,
4    z: i32,
5}
6
7let xyz = XYZ { x: 1, y: 2, z: 3 };
8
9// do something with xyz.x, xyz.y, and xyz.z
This allows you to access the variables in a more cache-friendly manner, improving spatial locality and reducing cache misses. Keep in mind that you should only use this technique when it makes sense for your program. If you don't need to access the variables together, then there's no point in grouping them into a struct.
Another technique is to use try using slices instead of linked lists or other dynamic data structures wherever possible. Slices provide better spatial locality because the elements are stored next to each other in memory, so accessing them is typically faster.
For example, consider a program that needs to iterate over a collection of integers. Instead of using a linked list:
1let mut list = LinkedList::new();
2list.push_back(1);
3list.push_back(2);
4list.push_back(3);
5
6for item in list {
7    // do something with item
8}
You can use a statically sized slice instead:
1let array = [1, 2, 3];
2
3for item in &array {
4    // do something with item
5}
By using a slice here, you are accessing adjacent elements in memory, which improves spatial locality and reduces cache misses. If you had used a linked list, the elements could be scattered throughout memory, potentially resulting in more cache misses and slower processing time.
Overall, understanding the memory hierarchy and optimizing your code accordingly can lead to significant performance improvements. By paying attention to how you use and access data in memory, you can effortlessly improve your code.
The Cache
As briefly mentioned, the cache is a small but extremely fast type of memory which acts as a buffer between the CPU and main memory, allowing for faster access to data stored in its registers.
One way to optimize cache behavior is by using data structures that have good cache locality. As mentioned earlier, slices are a great choice because they store elements next to each other in memory. This means that accessing elements in a slice is more likely to result in cache hits, which can greatly improve efficiency.
Another technique is to use data structures that are designed for cache efficiency, such as the packed_simd crate. Packed SIMD (Single Instruction, Multiple Data) allows you to perform computations on multiple values simultaneously, which can greatly improve performance. By utilizing packed SIMD instructions, you can process large amounts of data with fewer instructions and reduce memory accesses.
By understanding what the cache is and how it works, you can make more informed decisions about how you structure your code and data to take advantage of its capabilities, ultimately leading to significant performance improvements.
Profiling and Benchmarking
Profiling and benchmarking your code is an essential step in optimizing its performance. Profiling allows you to identify bottlenecks and areas of improvement in your code, while benchmarking helps you measure the impact of optimizations and compare different implementations.
Profiling
Profiling involves analyzing the runtime behavior of your code to identify areas that consume a significant amount of time or resources. There are several profiling tools available for Rust, such as perf, Valgrind, and flamegraph. We'll talk more about Valgrind when we discuss inlining functions but for now, let's talk about flamegraph.
Flamegraph
Flamegraph is a popular profiling tool for Rust which generates a visual graph of your program's runtime stack trace. These graphs, called flame graphs (graphs plural is weird), provide a visual representation of where time is spent in your code, making it easier to pinpoint performance bottlenecks.
To get started with flamegraph, first install it via:
1cargo install flamegraphThen, you can use the cargo flamegraph command to test your compiled binaries:
1cargo flamegraph --deterministic --bin=heimdall -- decompile 0xc02aaa39b223fe8d0a0e5c4f27ead9083c756cc2 -d -vvv --include-sol --skip-resolvingWhich produces the following flamegraph.svg:

As you can see, the flame graph provides a visual representation of the time spent in different parts of your code. Within a flame graph:
- Each box represents a stack frame, or a function call.
- The height represents the stack depth, with the most recent stack frames on the top and older ones towards the bottom. Child frames reside above the function that called them. For example,
heimdall_common::ether::evm::disassemble::disassemblewas called byheimdall::decompile::decompile, so it appears above the decompile frame on the flame graph. - The width of a frame represents the total time a function, or one of its children, is being processed. You can hover over a frame for more details, and click on a frame to expand it for a more granular view.
- The color of each frame doesn't matter and is randomized, unless you use the
--deterministicflag which will keep function/color consistency across runs.
In this example, you can see that most of the processing time is spent within heimdall::decompile::decompile, with a suspiciously large box for regex::compile::Compiler::compile, which indicates that there might be room for some improvement here.
Benchmarking
Benchmarking involves measuring the performance of your code to compare different implementations or optimizations. Rust provides a built-in benchmarking framework called Criterion.
To use Criterion, add it as a dependency in your Cargo.toml:
1[dev-dependencies]
2criterion = { version = "0.5.3", features = ["html_reports"] }
3
4[[bench]]
5name = "my_benchmark"
Then, you can write your benchmark in ./benches/my_benchmark:
1use criterion::{black_box, criterion_group, criterion_main, Criterion};
2
3fn fibonacci(n: u64) -> u64 {
4    match n {
5        0 => 1,
6        1 => 1,
7        n => fibonacci(n-1) + fibonacci(n-2),
8    }
9}
10
11fn criterion_benchmark(c: &mut Criterion) {
12    c.bench_function("fib 20", |b| b.iter(|| fibonacci(black_box(20))));
13}
14
15criterion_group!(benches, criterion_benchmark);
16criterion_main!(benches);
Finally, run this benchmark with:
1cargo benchAlways remember to benchmark your code when making optimizations to ensure that the changes you make actually improve your program's performance. If the benchmarks don't show a speed improvement significant enough to warrant the optimization, it's probably not worth including.
Optimizing Algorithms and Data Structures
Another key aspect of writing efficient Rust code is optimizing the algorithms and data structures that you use within your programs.
Choosing the Right Data Structure
The choice of algorithm can have a huge impact on the performance of your code. Some algorithms are inherently more efficient than others for certain types of problems, which is why it's important to choose an algorithm that is well-suited to your problem.
For example, the standard HashMap data structure in Rust is implemented as a hash table, which provides constant-time average case lookup, insertion, and deletion. This type will generally work well for a large set of use cases, which is why it's the go-to data structure for many developers. However, other data structures with similar functionality might work better for specific problems, such as BTreeSet or BTreeMap, which excel at maintaining sorted collection of elements. These data structures provide logarithmic-time operations for these types of operations, which can be more efficient than the standard HashMap in specific cases.
Make sure to carefully consider which data structure is best suited for your problem, as choosing the right data structure can have a huge impact on the performance of your code.
Optimizing Algorithms and Functions
In addition to choosing the right data structure, optimizing the algorithms you use can also greatly improve the efficiency of your programs.
Caching Results
One common optimization technique is caching function results. If a function may be called multiple times with the same input, you can cache the result and return it instead of recomputing it every time. This can be especially useful for reducing the amount of expensive computations that need to be performed.
Let's say you have an expensive function that performs a database query and returns it's result. If you call this function multiple times with the same input, you can simply save the result and return it instead of expensively recomputing the result every time, which can significantly improve the performance and efficiency of your code. It's important to keep in mind that if the data changes, you'll need to invalidate the cache and recompute the result.
1use std::collections::HashMap;
2
3fn get_data_from_database(id: u32, cache: &mut HashMap<u32, String>) -> String {
4    if let Some(data) = cache.get(&id) {
5        return data.clone();
6    }
7
8    let data = perform_expensive_database_query(id);
9    cache.insert(id, data.clone());
10    data
11}
12
13fn perform_expensive_database_query(id: u32) -> String {
14    // Simulating an expensive database query
15    println!("Performing database query for ID {}", id);
16    // ... actual database access and retrieval of data ...
17    let data = format!("Data for ID {}", id);
18    data
19}
20
21fn main() {
22    let mut cache: HashMap<u32, String> = HashMap::new();
23
24    // Query data from the database multiple times
25    for _ in 0..5 {
26        let id = 42;
27        let data = get_data_from_database(id, &mut cache);
28        println!("Data: {}", data);
29    }
30}
Running the above code, we can see that the database query is only performed once, even though we called the get_data_from_database function multiple times with the same input. This is because we cache the result and return it instead of recomputing it every time, saving us from performing the expensive lookup unnecessarily.
1Performing database query for ID 42
2Data: Data for ID 42
3Data: Data for ID 42
4Data: Data for ID 42
5Data: Data for ID 42
6Data: Data for ID 42
Understanding Time & Space complexity
Understanding the time complexity of your algorithms is crucial for writing efficient code. Time complexity describes how the runtime of an algorithm grows as the size of the input increases. By choosing algorithms with better time complexity, you can significantly improve the performance of your code.
For example, let's say you wanted to sort a list of items. If you use a simple bubble sort algorithm, which has an average-case time complexity of , it would take significantly longer than using a more efficient sorting algorithm like quicksort, which has an average time complexity of .
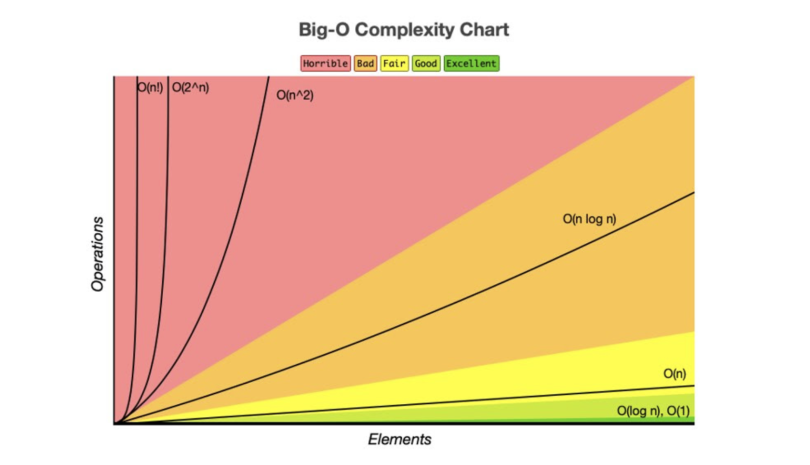
Understanding the time complexity of different algorithms allows you to choose the most efficient one for your specific problem. When choosing an algorithm, it's important to consider factors like the size of your input and any constraints or requirements you have in order to optimize for performance. For a more detailed look at time and space complexity, check out this article.
Memory Optimization
In addition to optimizing algorithms and data structures, memory optimization is another important aspect of writing efficient Rust code.
Specify Capacity When Known
In Rust, you can use the Vec type for dynamic arrays. When adding elements to a Vec, it automatically manages the underlying buffer and reallocates it when necessary. However, this reallocation process involves allocating new memory, copying existing elements over, and deallocating the old buffer.
To avoid unnecessary reallocations, you can preallocate a Vec with an initial capacity using the with_capacity method:
1let mut vec = Vec::with_capacity(100);By providing an initial capacity that matches or exceeds your expected number of elements, you can reduce or eliminate reallocations during runtime. This type of optimization also works with data structures that reallocate memory, such as Strings, HashMaps, etc:
1let mut vec = Vec::with_capacity(100);
2
3for i in 0..100 {
4    vec.push(i);
5}
In this case, the Vec is initialized with a capacity of 100, so it does not need to reallocate memory during the loop, and as a result, runs faster:
1benchmark_vec_with_capacity:
2    348μs 233ns ± 181μs 355ns per run ( with 100000 runs ).
3benchmark_vec_many_reallocations:
4    361μs 826ns ± 151μs 918ns per run ( with 100000 runs ).
Use Buffers When Possible
Additionally, consider reusing existing buffers instead of creating new ones whenever possible. This also avoids unnecessary memory management operations and can improve your program's performance.
1fn iterate_with_buffer() {
2    let mut buffer = Vec::new();
3
4    for i in 0..1000 {
5        buffer.clear();
6        buffer.push(i);
7    }
8}
9
10fn iterate_with_new_vec() {
11    for i in 0..1000 {
12        let mut buffer = Vec::new();
13        buffer.push(i);
14    }
15}
In this example, the iterate_with_buffer() function uses the same vector for each loop, clearing it before each iteration, while iterate_with_new_vec() creates a new vector for each loop. Using the existing vector allows you to reuse already allocated memory, avoiding any unnecessary memory operations.
1benchmark_iterate_with_buffer:
2    1μs 37ns ± 958ns per run ( with 100000 runs ).
3benchmark_iterate_with_new_vec:
4    42μs 615ns ± 6μs 992ns per run ( with 100000 runs ).
Avoid Unnecessary Cloning
In Rust, cloning an object creates a deep copy of the object, which can be expensive in terms of memory and performance. Therefore, it's important to avoid unnecessary cloning whenever possible.
One way to avoid unnecessary cloning is by using references instead of owned values. References allow you to borrow a value without taking ownership of it, which means you can access a read-only version of the value without needing to clone it:
1fn do_something_inefficiently() {
2    fn process_vec(vec: Vec<i32>) -> i32 {
3        vec.iter().sum()
4    }
5
6    let vec = (0..1000).collect::<Vec<u128>>()
7
8    for _ in 0..10_000 {
9        process_vec(vec.clone());
10    }
11}
12
13fn do_something_with_speed() {
14    fn process_vec(vec: &Vec<i32>) -> i32 {
15        vec.iter().sum()
16    }
17
18    let vec = (0..1000).collect::<Vec<u128>>()
19
20    for _ in 0..10_000 {
21        process_vec(&vec);
22    }
23}
By passing a reference to vec, you avoid cloning it and instead allow the function to borrow it's value temporarily. This eliminates unnecessary memory allocations and copying, improving performance. Don't worry about messing up this borrowing stuff, the compiler will tell you if you're doing something wrong.
A great tool for finding unnecessary clones is clippy, which is a general purpose linting tool for Rust. It can detect and warn you about unnecessary clones, among other things. Keep in mind that clippy won't catch everything, so it's important to keep an eye out for these types of optimizations yourself.
1benchmark_do_something_inefficiently:
2    35ns ± 77ns per run ( with 100000 runs ).
3  benchmark_do_something_with_speed:
4    30ns ± 105ns per run ( with 100000 runs ).
Use Enum Variants for Different Data Types
If you have a collection that can contain different types of elements, consider using an enum to represent the different variants. This allows you to store elements with different types in the same collection without wasting memory on padding or alignment requirements:
1enum Element {
2    Integer(i32),
3    Float(f32),
4}
5
6fn main() {
7    let mut elements: Vec<Element> = Vec::new();
8    elements.push(Element::Integer(5));
9    elements.push(Element::Float(3.14));
10
11    for element in elements {
12        match element {
13            Element::Integer(i) => println!("Integer: {}", i),
14            Element::Float(f) => println!("Float: {}", f),
15        }
16    }
17}
In this example, the Element enum has two variants: Integer and Float, which can each hold a different type. Here, we create a vector of Elements and push different types into it, which we can then iterate over and operate on seamlessly.
Using an enum with variants allows us to have a collection that can store different types of values without wasting memory. This is especially useful when dealing with heterogeneous data structures or when you want to represent multiple possibilities in a single variable.
Use Bitflags
If you have a collection of boolean values, consider using a bitflag instead of a vector of booleans. This can significantly reduce memory usage and improve performance. A bitflag is a data structure that stores boolean values as bits instead of bytes, which allows you to store multiple boolean values in a single byte.
For example, let's take a look at chess bitboards. A chess bitboard is a 64-bit integer that represents the state of a chessboard. Each bit in the integer represents a square on the board, with a value of 1 indicating that the square is occupied and a value of 0 indicating that it is empty. The starting position in chess can be represented as follows:
11111111111111111000000000000000000000000000000001111111111111111This bitboard represents the starting position in chess, with the first 8 bits representing the first row, the next 8 bits representing the second row, and so on. Each bit is set to 1 if the square is occupied and 0 if it is empty.
By combining bitboards, you can represent the state of the entire chessboard in just a few 64-bit integers, allowing you to perform operations on the entire board at once, which can significantly improve performance. For more on bitboards, check out this article. I strongly recommend checking this out. Bitboards are extremely cool, and the whole game of chess can be reduced to math and bitwise operations.
Use Cows
Another way to optimize memory usage in Rust is to use the Cow, or "clone on write" type. The Cow type allows you to have a value that can be either borrowed or owned, depending on whether it needs to be modified. When you have a value that may or may not need modification, using Cow can help avoid unnecessary cloning and memory allocations.
The Cow type provides two variants: Borrowed, which holds a reference to the original value, and Owned, which holds an owned copy of the value. For example:
1use std::borrow::Cow;
2
3fn process_string(s: Cow<&str>) {
4    if s.len() > 10 {
5        println!("Long string: {}", s);
6    } else {
7        println!("Short string: {}", s);
8    }
9}
10
11fn main() {
12    let short_string = "hello";
13    let long_string = "this is a very long string";
14
15    process_string(Cow::Borrowed(short_string));
16    process_string(Cow::Borrowed(long_string));
17
18    let cloned_long_string = long_string.to_owned();
19
20    process_string(Cow::Owned(cloned_long_string));
21}
In this example, the process_string function takes a Cow<&str> as its parameter, checks the length of the string and prints either "Long string" or "Short string" depending on its length.
Here, we create two string variables: short_string and long_string, which we then pass to the process_string function using Cow::Borrowed. Since these strings do not need modification, they are borrowed rather than cloned. Next, we create a new variable called cloned_long_string, which is an owned copy of the original long string. We pass this cloned string to the process_string function using the Cow::Owned variant, since we needed a mutable copy of the string.
By using the appropriate variant of Cow, we avoid unnecessary cloning and memory allocations. If a value does not need modification, it can be borrowed instead of being owned. Only when a value needs to be modified do we create an owned copy. For more information on Cows, check out this article.
Avoid Collecting for Another Iteration
When working with collections in Rust, it's important to consider using iterators instead of collecting into another data structure just to iterate over it again. This can help optimize memory usage and improve performance.
For example, let's say we have a Vec of numbers and we want to find the sum of all even numbers:
1fn sum_of_even_numbers(numbers: Vec<i32>) -> i32 {
2    let even_numbers: Vec<i32> = numbers.into_iter().filter(|&x| x % 2 == 0).collect();
3    even_numbers.iter().sum()
4}
In this code, we first create a new Vec called even_numbers by filtering out all odd numbers from the original numbers vector. We then use the iter() method to create an iterator over the even_numbers vector and calculate their sum using the sum() method.
However, this approach is not memory-efficient because it requires creating a new vector just for iteration purposes. Instead, we can directly iterate over the filtered elements without collecting them into another data structure:
1fn sum_of_even_numbers(numbers: Vec<i32>) -> i32 {
2    numbers.into_iter().filter(|&x| x % 2 == 0).sum()
3}
In this updated code, we directly iterate over the filtered elements using the into_iter() method and calculate their sum using the sum() method. This avoids creating a new vector and improves memory efficiency.
Inlining
Inlining is a compiler optimization technique that replaces a function call with the actual body of the function, which can improve performance by reducing the overhead of function calls and enabling further optimizations.
In Rust, you can use the #[inline] attribute to suggest to the compiler that a function should be inlined. The compiler may choose to honor this suggestion or not, depending on various factors such as code size and performance impact. For example:
1#[inline]
2fn add(a: i32, b: i32) -> i32 {
3    a + b
4}
5
6fn main() {
7    let result = add(1, 2);
8    println!("Result: {}", result);
9}
In this code, we define a simple add function that takes two integers and returns their sum. We annotate it with #[inline] to suggest inlining. When calling this function in the main function, the compiler may choose to inline it instead of generating a separate call instruction.
Inlining can improve performance by eliminating the overhead of function calls, since it allows for better optimization opportunities such as constant propagation and loop unrolling. However, it can also increase code size if used excessively and should be used sparingly.
Cachegrind
Cachegrind is a profiling tool that is part of the Valgrind suite which simulates a CPU cache hierarchy and provides detailed information about cache misses, cache hits, and other cache-related performance metrics.
To use Cachegrind with Rust programs, you can first compile your program with debug symbols using the --debug flag:
1cargo rustc -- --emit=asm -C opt-level=3 --debugThis will generate assembly code for your Rust program, which you can then run through Cachegrind using the following command:
1valgrind --tool=cachegrind ./target/debug/my_programAfter execution completes, cachegrind will generate a report that includes information such as the total total number of instructions executed, the number of cache misses at each level, and the average cost per instruction. By analyzing this report, you can identify areas in your code where there are a high number of cache misses, indicating potential performance bottlenecks. You can then optimize these areas to improve cache utilization and overall program performance.
Rust Build Configuration
Rust provides many build configuration options which allow you to control how the Rust compiler generates machine code and optimizes various aspects of your program.
Release Mode
When compiling your Rust code, it's important to use the --release flag to enable optimizations. By default, Rust builds in debug mode, which includes additional checks and information for debugging purposes, sacrificing performance. To build your code with the release profile, use the following command:
1cargo build --releaseThe --release flag tells Cargo to enable optimizations like inlining function calls, removing unnecessary checks, and optimizing data structures. This can result in significant performance improvements. Under the hood, this is the same as using the RUSTFLAGS -C opt-level=3.
Link-Time Optimization
Link-time optimization is a technique that allows the compiler to perform optimizations across multiple translation units during the linking phase which can result in more aggressive optimizations and better runtime performance.
To enable LTO in your Rust code, you can use the lto option in your Cargo.toml file under the [profile.release] section:
1[profile.release]
2lto = fat
This will enable link-time optimization across all codegen units in your project, which can result in better performance but may increase the size of your binary. Keep in mind that enabling LTO may increase build times and memory usage, so it's important to consider the trade-offs for your specific project.
Codegen Units
Codegen units are a compilation unit used by the Rust compiler to parallelize code generation. By default, the Rust compiler uses one codegen unit per CPU core, which allows for faster compilation times. However, using multiple codegen units can also improve runtime performance by allowing the compiler to optimize each unit independently.
You can control the number of codegen units used by the Rust compiler by setting the codegen-units option in your Cargo.toml file under the [profile.release] section:
1[profile.release]
2codegen-units = 1
This will instruct Cargo to use 1 codegen unit during release builds, which can help the compiler find more optimizations across crates in your project.
Using an Alternative Allocator
By default, Rust uses the system's allocator for managing memory. However, in certain cases, you may want to use an alternative allocator that provides better performance or specific features.
To use an alternative allocator in your Rust code, you can specify it in your Cargo.toml file under the [dependencies] section:
1[dependencies]
2jemallocator = "0.3"
Note that using an alternative allocator might not always result in better performance. It's important to benchmark your code to determine if it's worth using an alternative allocator.
Compiler Flags
Rust provides several compiler flags that allow you to control various aspects of code generation and optimization. These flags can be set using the RUSTFLAGS environment variable or directly in your Cargo.toml file.
Here are some commonly used compiler flags:
-C target-cpu: Specifies the target CPU architecture. This allows the compiler to generate machine code optimized for a specific CPU. For example, settingtarget-cputonativewill tell the compiler to look for optimizations for this machines CPU.-C debuginfo: Controls whether debug information is included in the generated binary. Disabling debug info can reduce binary size but makes debugging more difficult.-C panic=abort: Changes how panics are handled by aborting instead of unwinding, which can improve performance at the cost of not being able to catch panics withcatch_unwind.
Conclusion
Writing efficient code in Rust goes beyond merely adhering to the language's rules. It requires a deep understanding of the underlying hardware architecture, careful optimization of algorithms and data structures, minimizing memory allocations, leveraging parallelism, and proficiently profiling your code to pinpoint bottlenecks. In this article, we explored a range of techniques and best practices that can significantly enhance the performance of your Rust programs.
Hopefully, this article has helped you become a better (and more performant) rustacean. If you have any questions or suggestions, feel free to reach out to me on Twitter. Thank you!
Resources & Citations
- Pascal Hertleif, "The Secret Life of Cows", Deterministic Space, Jun 2018. Available: https://deterministic.space/secret-life-of-cows.html
- Unknown, "Bitboards", Chess Programming Wiki, Mar 2022. Available: https://www.chessprogramming.org/Bitboards
- Rust Team, Clippy, GitHub, Jul 2021. Available: https://github.com/rust-lang/rust-clipp
- Tara Dwyer, "A Beginner's Guide to Analysing Time and Space Complexity", Medium, Jun 2023. Available: https://levelup.gitconnected.com/a-beginners-guide-to-analysing-time-and-space-complexity-31e1677f5f5b
- Brook Heisler, Criterion, GitHub, Jan 2021. Available: https://bheisler.github.io/criterion.rs/book/index.html
- flamegraph-rs, Flamegraph, GitHub, Jun 2023. Available: https://github.com/flamegraph-rs/flamegraph
- Valgrind Developers, Valgrind, Valgrind, Jul 2023. Available: http://valgrind.org/
- Unknown, Perf, Perf Wiki, Feb 2023. Available: https://perf.wiki.kernel.org/index.php/Main_Page
- Rust Team, Packed_SIMD, GitHub, Jul 2021. Available: https://github.com/rust-lang/packed_simd
- Rust Team, Concurrency, Rust Book, Jul 2023. Available: https://doc.rust-lang.org/book/ch16-00-concurrency.html
- Rust Team, Rust Book, Rust Book, July 2023. Available: https://doc.rust-lang.org/book/
- Rust Team, Rustlings, GitHub, July 2023. Available: https://github.com/rust-lang/rustlings